
Climate Ready North Bay: Key Vulnerability Assessment Findings for the North Bay Region
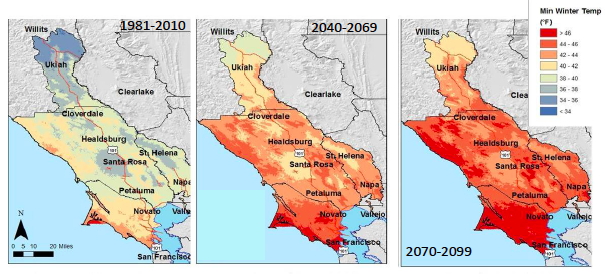 Maps of projected minimum winter air temperatures for current and two modeled future scenarios. |
Table of Contents
Download the Complete Region-wide Findings Technical Memo (PDF, 2.5 mb) and the CRNB North Bay Slide Deck (PDF, 11 mb) |
Summary of Key Vulnerability Assessment Findings
Key findings for the North Bay region include a unidirectional trend, regardless of total rainfall, towards increasing climatic water deficits across model scenarios. Therefore, managers will be facing an increasingly arid environment. Water supply indicators generally increase in variability across all scenarios, with the extreme scenarios ranging from approximately 25% greater to 25% less total rainfall, with direct implications for runoff, recharge, stream-flow and soil moisture. The climate suitability for vegetation types in the North Bay will favor drought-tolerant species, while fire risks are projected to double in especially fire prone regions. The combination of potential drought stress on water supplies and vegetation, with an approximate doubling of fire risks, should inform long-term adaptive management of natural resources. Working with agencies on potential Climate Ready North Bay product applications, strategies should build watershed resilience to drought with a focus on protecting groundwater recharge. Drought tolerance also needs to be promoted in forest, rangeland, and agricultural systems. More aggressive approaches to the reduction of forest fuel loads should be considered.
|
Rainfall is the most variable input value to the BCM for the North Bay region as a whole and for Sonoma County, and drives the majority of variability in primary hydrologic response outputs and secondary outputs for potential vegetation transitions and fire risks. Table 1 summarizes BCM projected long-term trends in 30-year time steps from 2010-2099 for temperature, rainfall, runoff, recharge, and climatic water deficit in comparison to current conditions averaged over 1981-2010, (see Appendix C also references the North Bay region summary data table). Three “business as usual” emissions scenarios are included: Scenario 5: Warm, high rainfall (the highest rainfall model in TBC3’s Bay Area BCM), Scenario 6: Hot, low rainfall (the lowest rainfall model in the TBC3’s Bay Area BCM), and Scenario 3: Warm, moderate rainfall (the closest future to the mean of all rainfall projections for TBC3’s Bay Area BCM). These three scenarios can be considered to “bookend” high and low rainfall extremes (Scenarios 5 and 6 respectively) and a “middle of the road” future (Scenario 3).
This wide variation between model rainfall projections is the greatest source of uncertainty in projected future conditions. With values ranging from approximately 21% less or 35% greater rainfall by end century at the scale of 30-year average values, managers need to determine how to plan in the face of this magnitude of uncertainty. Climate Ready North Bay products allow managers to consider the range of physical and ecological impacts caused by variable rainfall, and to “unpack” the annual and seasonal variability underlying these long-term average values.
It is important to point out that, despite this broad range of projected increases or decreases in rainfall, estimated climatic water deficit (which is quantified as the amount of evaporative demand exceeding available soil moisture) is expected to increase across all futures. This provides managers with a key landscape condition and water demand indicator that varies in intensity but not direction. Changes in water deficit are a critical driver of agricultural sustainability, native vegetation response, and fire risk as described in more detail below.
Throughout the North Bay region, 30-year averages for summer and winter air temperatures are projected to increase. Maximum monthly summer air temperatures are projected to increase by as much as 11 degrees F and minimum monthly winter air temperature to increase by as much as 7.6 degrees F by the end of century for the “worst case” hot and low rainfall Scenario 6.
Figure 2. Maximum summer temperature, North Bay Region, 1981-2100, 30-year averages, warm and moderate rainfall scenario
Figure 3. Minimum winter temperature, North Bay Region, 30-year averages, 1981-2099, warm and moderate rainfall scenario
For the 30-year average representing 1981-2010, defined as “current conditions,” the average maximum monthly average summer air temperature was 82.2 degrees F. For the mid-century period 2040-2069, under “business as usual” scenarios, potential 30-year averages for monthly maximum summer air temperatures are estimated to span the range below.
Scenario 3: Warm, moderate rainfall - 86.0 degrees F, equivalent to an increase of 3.8 degrees F
Scenario 5: Warm, high rainfall - 86.4 degrees F, equivalent to an increase of 4.2 degrees F
Scenario 6: Hot, low rainfall - 89.2 degrees F, equivalent to an increase of 7.0 degrees F
For 2070-2099, under “business as usual” scenarios, potential changes in maximum monthly average summer air temperature by end-century are estimated to span the range below.
Scenario 3: Warm, moderate rainfall - 88.5 degrees F, equivalent to an increase of 6.3 degrees F
Scenario 5: Warm, high rainfall - 89.4 degrees F, equivalent to an increase of 7.2 degrees F
Scenario 6: Hot, low rainfall - 93.4 degrees F, equivalent to an increase of 11.2 degrees F
From 1981-2010, the 30-year average for minimum monthly winter air temperatures was 39.7 degrees F. For 2040-2069, under “business as usual” scenarios, potential changes in minimum monthly average winter air temperatures by mid-century are estimated to span the range below.
Scenario 3: Warm, moderate rainfall - 43.0 degrees F, resulting in an increase of 3.3 degrees F
Scenario 5: Warm, high rainfall - 43.0 degrees F, resulting in an increase of 3.3 degrees F
Scenario 6: Hot, low rainfall - 44.1 degrees F, resulting in an increase of 4.4 degrees F
For 2070-2099, under “business as usual” scenarios, potential changes in minimum monthly average winter air temperatures are estimated to span the range below by end-century.
Scenario 3: Warm, moderate rainfall - 44.8 degrees F, resulting in an increase of 5.1 degrees F
Scenario 5: Warm, high rainfall - 45.9 degrees F, resulting in an increase of 6.1 degrees F
Scenario 6: Hot, low rainfall - 47.3 degrees F, resulting in an increase of 7.6 degrees F (2.5 degrees F greater than the moderate warming scenario)
Increases in monthly maximum and minimum temperatures estimated for 30-year time periods represent underlying significant increases in the frequency and intensity of warmer conditions at the monthly and daily time scales. For example, for the Santa Rosa Plain, there is up to a five-fold projected increase in the total number of days exceeding 95 degrees F, with an average of 26 per year measured over 1981-2010, compared to 146 per year projected by the end of the century. In the Alexander Valley, averaged across four future scenarios, there is an overall decrease in the number of springtime (February, March, April) days that are at or below freezing by both mid- and end-century. By the end of the century, on average, the number of days that are at or below freezing are projected to decrease on the order of 50% in February (from 52 to 27), over 60% in March (from 8 to 5), and 100% in April (from 5 to 0). (Please refer to slides 68-70 in the companion CRNB North Bay Slide Deck for illustration.)
Projected increases in temperature result in increased rates of evapo-transpiration that, in turn, drive changes throughout the hydrologic cycle, which are explored in the following sections. Warmer temperatures effectively generate dryer soil conditions, which then creates more room for storing moisture subsurface in soils and aquifers, potentially reducing the total amount of available surface water.
Slides 41-46 in the companion CRNB North Bay Slide Deck illustrate the data findings above.
Increasing Variability in Rainfall
The future of rainfall quantity and variability for the North Bay region over the next century is perhaps the greatest uncertainty in efforts to project future conditions. Global models vary widely in their estimates of how climate change will impact rainfall patterns. This is because the potential effect of increased temperatures on the dynamic circulation of the oceans and atmosphere, which produces local rainfall, is not well understood in terms of mechanics. Therefore, some models estimate that for the North Bay region global warming will result in a major increase in available rainfall (Scenario 5), while others project little change (Scenarios 1, 2, 3), or moderate to major reductions (Scenario 4 and Scenario 6). Interestingly, for both mid-century and end-century values, projected changes in precipitation in the negative and positive directions essentially cancel each other out in the ensemble average, with no net average change in precipitation when the six models are averaged together. However, an examination of annual values underlying these long-term averages does show, in most projections, a trend of increasing variability in rainfall from year to year.
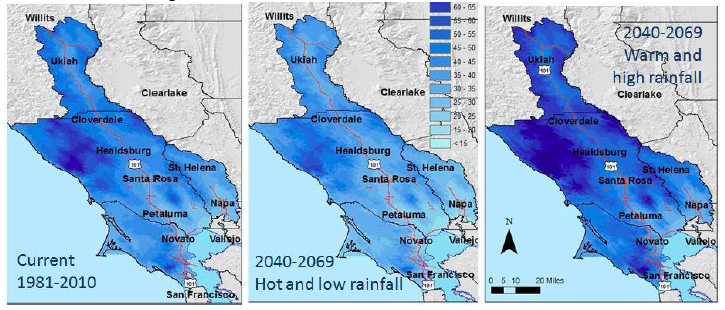
Figure 4. Precipitation, 30-year averages, current (1981-2010), and projected (2040-2069) hot and low rainfall and warm and high rainfall scenarios
For 1951-1980 and 1981-2010, both the historic and current regional average rainfall was approximately 43 inches per year. For 2040-2069, average annual rainfall is projected to span the range below.
Scenario 3: Warm, moderate rainfall - 42.1 in/y, 2% less than the current average
Scenario 5: Warm, high rainfall - 53.6 in/y, 25% greater than the current average
Scenario 6: Hot, low rainfall - 34.8 in/y, 19% less than the current average
For 2070-2099, potential changes in average annual rainfall are projected to span the range below.
Scenario 3: Warm, moderate rainfall - 44.8 in/y, 6% greater than the current average
Scenario 5: Warm, high rainfall - 57.9 in/y, 35% greater than the historic/current average
Scenario 6: Hot, low rainfall - 33.9 in/y, 21% less than the historic/current average
A comparison of extreme rainfall years can be made using annual rainfall totals for the historic period of 1920-2009, including both high rainfall years likely to correspond with flood risks, and low rainfall years likely to correspond with drought risks (Table 2). This comparison shows that if an average is taken across the six projected futures, annual peak rainfall years (defined as exceeding the 90th percentile value of the 1920-2009 period) and low rainfall years (defined as less than the 10th percentile value of the 1920-2009 period) are projected to both increase on the order of 200% and 160%, respectively. However “worst case scenarios” in terms of high and low rainfall over 30-year periods correspond to more drastic increases in extreme events. For example, under the warm and high rainfall scenario, an approximate five-fold increase in high flood risk years is projected, while under low rainfall scenarios an approximate three-fold increase in potential drought years is projected.
We recommend that at this point natural resource managers plan for both high rainfall and low fall rainfall scenarios. For Climate Ready North Bay partners, this has meant taking the worst case drought scenarios and analyzing whether or not current infrastructure would still allow agencies to meet projected demand. It is also suggested for flooding, and with more certainty fire, increased resources may need to be dedicated to hazard mitigation.
Slides 29-35 in the companion CRNB North Bay Slide Deck illustrate the data findings above.
Impacts on Watershed Functions: Runoff, Recharge, and Climatic Water Deficit
The benefit of utilizing the Basin Characterization Model is that it takes projected values for rainfall and temperature and tests how these climatic patterns would interact with local topography, soils, and underlying geology. The model achieves this by calculating a water balance for every 18-acre unit in the North Bay domain. This memorandum summarizes results at the scale of the entire region, while companion memoranda developed for partner agencies isolate results for source watersheds and other regions of interest. These variables are critical to shaping climate smart strategies focused on maintaining water yields and sustainable patterns for future urbanization.
Recharge and runoff both vary with projected precipitation, yet recharge proves more resilient (less variable) than runoff in response to major fluctuations in rainfall, as described below. The spatial variability of high and low groundwater recharge zones can be estimated using the model, a valuable input for sustainable groundwater management. Climatic water deficit projections show what portions of the landscape are vulnerable to drought stress, and also serve as an indicator of irrigation demand. Taken together, this integrated water balance approach to estimating the impacts of future climate change on the local hydrology is a potent tool for determining vulnerabilities and potential adaptation strategies.
Runoff
The amount of runoff is estimated on the amount of incoming rainfall combined with how pervious the watershed is given local soils and bedrock. Climate Ready North Bay data products are capable of estimating the relative variable “flashiness” of watersheds in the study area. Runoff can be used to estimate yield into reservoirs or streams, as well as to provide an indicator of flooding risks.
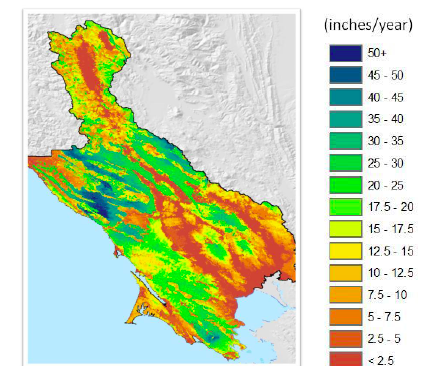
Figure 6. Estimated runoff, North Bay Region, 30-year average, 1981-2010
From 1981-2010, the average amount of runoff for the North Bay region was 14.2 inches per year, per unit area. From 2040-2069, the range of potential change in average amount of annual runoff is projected as follows.
Scenario 3: Warm, moderate rainfall - 14.0 in/y, 1% less than the current average
Scenario 5: Warm, high rainfall - 22.8 in/y, 61% greater than the current average
Scenario 6: Hot, low rainfall - 9.7 in/y, 32% less than the current average
For 2070-2099, the range of potential change in average amount of annual runoff is projected as follows.
Scenario 3: Warm, moderate rainfall - 17.3 in/y, 22% greater than the current average
Scenario 5: Warm, high rainfall - 26.9 in/y, 90% greater than the current average
Scenario 6: Hot, low rainfall - 9.3 in/y, 34% less than the current average
Slides 29-33 in the companion CRNB North Bay Slide Deck illustrate the data findings above.
Groundwater Recharge
The Basin Characterization Model was specifically designed to estimate subsurface recharge using empirical watershed characteristics. Summaries of historic and projected recharge across the North Bay as a whole are summarized below.
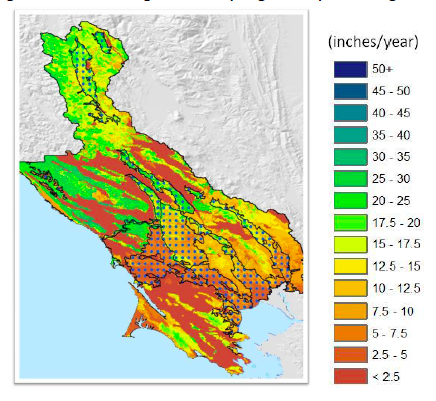
Figure 7. Estimated groundwater recharge, North Bay Region, 30-year average, 1981-2010
For 1981-2010, the average amount of groundwater recharge was 10.2 inches per year per unit area. For 2040-2069, the range of potential change in average amount of annual recharge is projected as follows.
Scenario 3: Warm, moderate rainfall - 10.7 in/y, 4% greater than the current average
Scenario 5: Warm, high rainfall - 12.8 in/y, 25% greater than the current average
Scenario 6: Hot, low rainfall - 8.2 in/y, 20% less than the current average
For 2070-2099, the range of potential change in average amount of annual recharge is projected as follows.
Scenario 3: Warm, moderate rainfall - 10.8 in/y, 6% greater than the current average
Scenario 5: Warm, high rainfall - 13.2 in/y, 29% greater than the current average
Scenario 6: Hot, low rainfall - 8.5 in/y, 17% less than the current average
Slides 36-40 in the companion CRNB North Bay Slide Deck illustrate the data findings above.
Relationship of Runoff to Recharge
The North Bay Climate Ready project area is highly variable in terms of the spatial distribution of potential surface runoff and recharge. While Sonoma, Mendocino, and Napa counties include significant groundwater recharge basins, the geology of Marin provides for very little ground water and therefore its supply is runoff-dominated. However, for regions with significant recharge storage potential there is also high variability in potential groundwater recharge within a particular basin, such as the Sonoma and Napa Valleys and the groundwater basin of the Russian River Basin.
Figure 8 demonstrates the relatively variability of runoff compared to recharge for a given rainfall quantity. The plot compares total runoff and recharge estimated for the entire area of Sonoma County using Scenarios 3, 5, and 6. The average historic values are 14.2 inches per year for runoff and 10.2 inches per year for recharge. The three future scenarios range from a minimum of 9.3 inches per year to a maximum of 26.9 inches per year for runoff (corresponding to -34% to +90% compared to current). Corresponding recharge values range from only 8.2 to 130.2 inches per year (-17% to +29% compared to current). Based on this analysis, recharge is shown to be a more consistent component of water yield over time relative to runoff. This is not to discount, however, the importance of big runoff years in supplying critical supply to reservoirs, streams, and aquifers. However the relative consistency of groundwater recharge even in low rainfall years suggests where groundwater is available, that sustainable groundwater management is a good investment in water security.
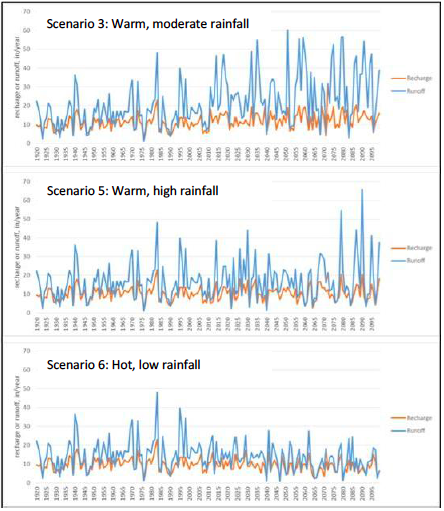
Figure 8: Estimated annual runoff and recharge, North Bay Region, 1920-2100, three future scenarios.
A simple metric that facilitates categorizing watersheds by their relative flashiness is the ratio of recharge to runoff for the North Bay—this value ranged from 0.79-.072 for the historic to current time periods, respectively. The concept of “conjunctive use” in water resources planning refers to looking at the relationship of surface and groundwater supplies as one resource that requires coordinated management. Climate Ready North Bay products may help facilitate conjunctive use approaches where feasible, including groundwater recharge protection and passive or active recharge of aquifers. In terms of watershed mechanics climatic water deficits, addressed below, interface with runoff and recharge by increasing more subsurface storage potential and thus creating more “room” in the soils for subsurface storage.
Climatic Water Deficit
Climatic water deficit is an attribute of the landscape that integrates the combined effects of available rainfall, temperature, and watershed structure. It takes into account available water, heat exposure, and soil/geology water storage potential to estimate where and by how much potential evapotranspiration exceeds actual evapotranspiration. This term can be thought of a measure of drought stress, or an estimate of how much more water the landscape would have used had it been available. It captures the effect of limited soil storage to meet evapotranspiration demand. As discussed below, it turns out to be an excellent indicator of native vegetation cover or agricultural irrigation demand and fire risks.
An important aspect of climatic water deficits is that, in comparison to rainfall for example, all of the future scenarios project a uni-directional trend in water deficits into the future. From 1981-2010 the average climatic water deficit over the study area was 28.4 inches per year. By the mid century, water deficits are projected to increase from 5-12%, with an average 8% increase across scenarios. By the end of the century, a range of 10-22% greater water deficit is projected, with an average of 14% across all scenarios, as is described below.
From 2040-2069, the range of potential change in climatic water deficit is projected as follows.
Scenario 3: Warm, moderate rainfall - 30.3 in/year, 7% greater than the current average
Scenario 5: Warm, high rainfall - 29.8 in/year, 5% greater than the current average
Scenario 6: Hot, low rainfall - 32.0 in/year, 12% greater than the current average
For 2070-2099, the range of potential change in climatic water deficit is projected as follows (Figure 3).
Scenario 3: Warm, moderate rainfall - 31.4 in/year, 11% greater than the current average
Scenario 5: Warm, high rainfall - 31.3 in/year, 10% greater than the current average
Scenario 6: Hot, low rainfall - 34.6 in/year, 22% greater than the current average
The magnitude of projected change in climatic water deficit is limited by the total subsurface soil storage potential in a given area. In other words, deeper soils with high soil moisture storage potential may be subject to larger changes than landscapes with thinner soils since they hold relatively more soil moisture. In addition, the impact of increased water deficit needs to be considered in the context of site-specific temporal variability. Regions that have historically been exposed to large variability in water deficits may be more resilient to future deficit increases then regions with historically low variability. The Climate Ready North Bay hypothesizes that small increase in water deficits in traditionally cooler and moister coastal areas this may pose a more significant impact than similar magnitudes of change inland, where watershed and ecosystem have adapted to high variability.
Slides 41-46 in the companion CRNB North Bay Slide Deck illustrate the data findings above.
For 22 dominant vegetation types, the probabilities for each vegetation type to occur in a given location within the study region under the six future climate scenarios were modeled. Overall, the sensitivity of vegetation to climate change was found to be highly heterogeneous across the region, though the sensitivity to climate change was somewhat higher under warm winter conditions (i.e., closer to the coast), on north-facing slopes and in areas of historic higher precipitation. While cool or moist sites may serve as refugia for species adapted to cool and moist conditions, the model suggests these sites will still be highly dynamic and relatively sensitive to climate-driven vegetation transitions (Ackerly et al. 2015). Model results have been summarized for each of the Conservation Lands Network landscape units, and can be accessed (BAOSC 2011).
Across the North Bay counties we observe the following trends, with the caveat that these trends represent the long-term equilibrium response that may be expected in response to varying magnitude of climate change. The modeling does not address the mechanisms of vegetation change (e.g., drought, fire, etc.), and does not incorporate the potential effects of dispersal limitation (i.e. absence of mature populations nearby producing seeds that can disperse to new locations). While we don’t know how quickly changes may occur, the fossil record since the last Ice Age in California and elsewhere demonstrates that periods of major climate change result in significant shifts in vegetation over time.
For Marin County significant reductions in suitable conditions for Redwood and Douglas-fir forests, and Montane Hardwood woodlands, are projected, especially for more than 4-5 °F warming. Grassland conditions may also decline, but the extent of grassland is heavily dependent on management actions (fire, grazing, etc.). Suitable climate for chamise chaparral and other shrublands, coast live oak woodlands, and knobcone pine are projected to expand. Establishment of knobcone pine and some chaparral species are promoted by fire; the extent and severity of wildfire in coming decades will likely have a strong impact on future vegetation.
In Sonoma County, similar reductions in suitable conditions for Redwood and Douglas-fir forests and Montane Hardwoods are projected. Oregon oak woodlands and montane chaparral are also projected to decline. Conditions suitable for coast live oak woodlands, chamise chaparral and other shrublands increase substantially, especially for scenarios above +4°F warming.
In Napa County, conditions suitable for Montane Hardwoods decline at higher temperatures, and montane chaparral also shrinks considerably. Conditions suitable for Chamise Chaparral, other shrublands, Coast Live Oak, and Interior Live Oak all increase in extent. The area suitable for blue oak varies, declining under higher rainfall scenarios, and otherwise remaining stable.
Slides 49-56 in the companion CRNB North Bay Slide Deck illustrate the data findings above. See also Vegetation Reports by North Bay Landscape Unit.
Increasing Fire Frequency
The fire frequency model used in Climate Ready North Bay expresses potential increases in fire risk as a function of probability of a burn or fire return estimated in years. Maps of future climate scenarios are shown for business-as-usual scenarios for end-century projections, and individual parcels and parks are illustrated for mid-century projections. In the attached CRNB North Bay deck.ppt results for the North Bay region as a whole are summarized below.
From 1971-2000, the average historic fire return interval was every 172 years. By the end of the century, fire return intervals are projected to be reduced by approximately 30% throughout the region.
Scenario 3: Warm, moderate rainfall - 120 yr average projected return interval
Scenario 6: Hot, low rainfall - 117 yr average projected return interval
From 1971-2000, the average historic probability of burning with a 30 year period was 17%. From 2070-2099, the probability of burning occurring one or more times within 30 years doubles in some locations, with the probability throughout the region projected to increase to 23% under both the warm, moderate rainfall and hot, low rainfall scenarios.
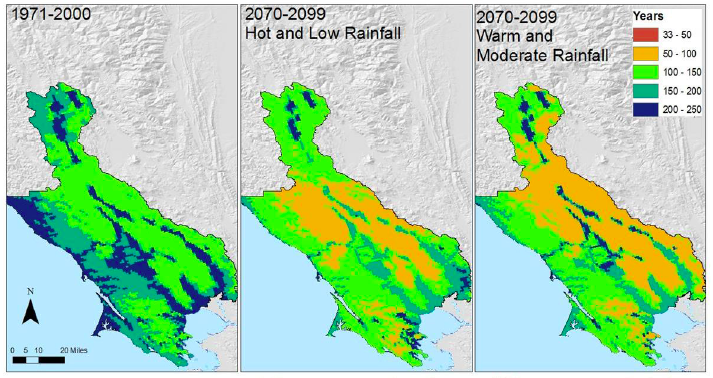
Figure 10. Historic and projected fire return intervals, 1971-2000 versus 2070-2099, two future scenarios
Back to the Climate Ready North Bay Homepage