
A Method for Assessing Climate Change Vulnerability of Rare Plants in California
|
Abstract
In this project researchers with the California Department of Fish & Wildlife used the NatureServe Climate Change Vulnerability Index tool and customized spatial modeling to evaluate the vulnerability of rare plants in California. The resulting 156 assessments and a refinement of the methodology will be helpful to those needing to incorporate rare plants into their climate-smart strategies. |
|
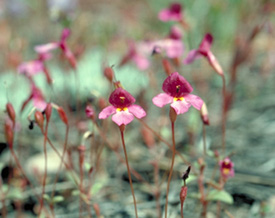 Above: Mimulus purpureus, a rare plant that the project scored "extremely vulnerable" to climate change. |
Results of the project:
The results of the assessment of the 156 species and a discussion of the methodology, including challenges and recommendations, may be found in the project's final report: Climate Change Vulnerability Assessment of Rare Plants in California. A more detailed journal article to be published in Madroño is currently in press. In addition, all the information used to make the determinations is offered at http://www.dfg.ca.gov/biogeodata/projects/climate.asp. |
|
How does one go about assessing the vulnerability of a plant species to climate change? The method involves assembling data for input into the NatureServe spreadsheet, specifically: 1. Climate Change Data-- Information about how much climate change will occur where the species grows and 2. Biological Data-- data showing how sensitive each species will be to future climate change based on its biological and geographical characteristics. One product of the research is a list of the literature found helpful in the collection of these details. A third component is the Geographic Factor: a prediction of whether future temperature and precipitation conditions are expected to have a positive or negative effect on the available habitat for each species using a technique called ‘species distribution modeling’. The authors conducted a detailed modeling for the 156 species for their projected range-shifts within California, but suggest that it could be done more simply by using the data found in Climate Wizard, an online tool for viewing and downloading future predictions of temperature and rainfall around the world. The project leads also investigated additional indices including topographic complexity, a measure of the diversity of the elevations, slopes, and aspects that the plant inhabits. In their report they discuss the merits of using them to strengthen an understanding of what is important for the plant species' conservation. |
|
| Are there any short-cuts? Deriving these inputs is time-consuming and presents many challenges. As part of this project, the researchers investigated whether the results of the CCVI analysis might be approximated with quicker estimates of vulnerability based on characteristics of the plant. They found that the CCVI scores were independent of the California Rare Plant Rank, rarity type, biogeographic affinity, duration, and growth form, suggesting that the CCVI analysis produces novel information about climate change vulnerability. And so there is, unfortunately, no short-cut to doing the more thorough data collection and processing. Researchers in other states can use the biological assessments for the 156 plant species already done, adding only the geographic component to complete an assessment relevant for their region. The project leads offer their assistance to those intending to use the results for the 156 evaluated species, or to conduct the analysis for additional species. For more information please contact Steve Schoenig. |
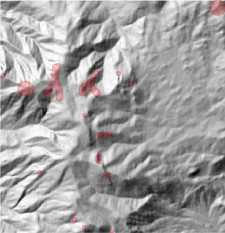 A map showing populations of a species with high topographic complexity, an index that can contribute to a finer understanding of climate change vulnerability for plant species. |
8/2017