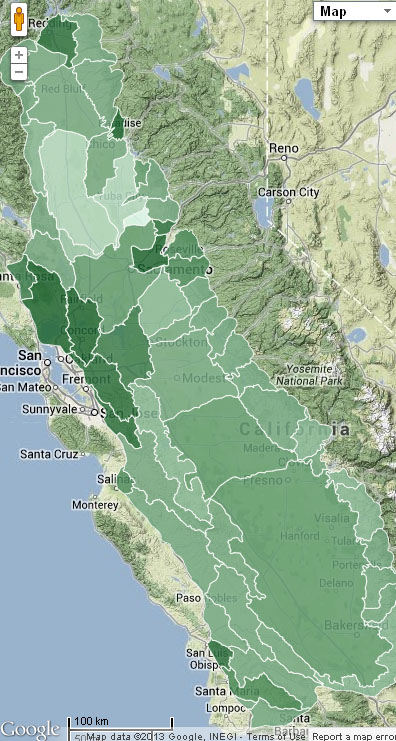
Percent change in grassland soil carbon sequestration potential from 2010 to 2040
These maps display the percent change in the potential for grassland soil carbon sequestration for each watershed under three IPCC-SRES scenarios – A1B, A2 and B1. Watershed boundaries are from the 8-digit Watershed Boundary Dataset (http://water.usgs.gov/GIS/huc.html). Here soil carbon represents soil organic carbon (up to 20 cm in depth).
Future change in soil carbon was modeled by the U.S. Geological Survey's General Ensemble Biogeochemical Modeling System (GEMS) (http://www.usgs.gov/climate_landuse/land_carbon/BGM.asp). Carbon model outputs were produced through the U.S. Geological Survey's (USGS) national carbon sequestration assessment of ecosystem carbon stocks, carbon sequestration, and greenhouse-gas fluxes under present conditions and future scenarios, required by the U.S. Congress (Energy Independence and Security Act of 2007). Under GEMS, soil carbon was estimated annually from 2006 to 2050 using three ecosystem models: the Erosion-Deposition-Carbon Model (EDCM), the CENTURY model, and a spreadsheet model. Change in carbon was based on land use-land cover change, simulations of areas burned by wildland fires, agricultural land management, climate, and other biophysical data. This rangelands project used the average of EDCM and CENTURY soil carbon model outputs for years 2010 and 2040 for each of three IPCC-SRES scenarios (A1B, A2 and B1).
The maps display the percent change in grassland soil carbon sequestration potential by watershed. Percent change in carbon sequestration potential is influenced by the extent of grassland conversion within a watershed over the 30 year time period. In most cases, grassland conversion to another land use such as development or intensive agriculture leads to a loss in soil carbon, and reduces the potential for future carbon sequestration. This metric and is calculated as:
ΔC = percent change in grassland soil carbon sequestration
A2010 = grassland area in 2010
A2040 = grassland area in 2040
Achange = area of grassland converted between 2010 and 2040
ΔSOCg = average change in soil organic carbon on undisturbed grassland from 2010 to 2040
ΔSOCd = average change in soil organic carbon on grasslands converted between 2010 and 2040
Reference
Zhu, Zhiliang, and Reed, B.C., eds., (2012) Baseline and projected future carbon storage and greenhouse-gas fluxes in ecosystems of the Western United States: U.S. Geological Survey Professional Paper 1797, 192 p. (Also available at http://pubs.usgs.gov/pp/1797/.)