
Climate Ready North Bay: Methodology and Supporting Information
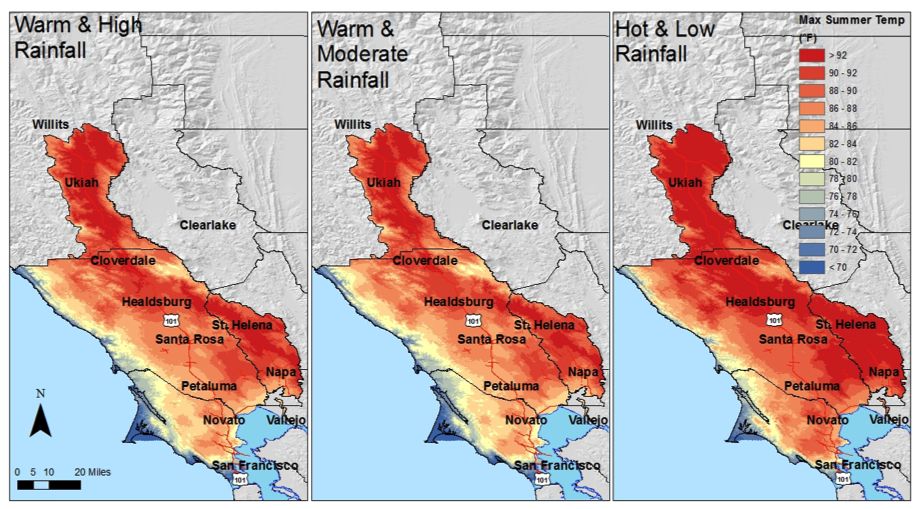 Maps of maximum summer temperatures for three different modeled future scenarios. Click for a larger image. |
Table of Contents
Download the Complete Region-wide Findings Technical Memo (PDF, 2.5 mb) and the CRNB North Bay Slide Deck (PDF, 11 mb) |
Selection of Future Climate Scenarios
The first Climate Ready North Bay regional stakeholder kick-off meeting was convened to select a consistent set of climate-hydrology “futures” based on regional management concerns. User groups were first introduced to a series of 18 Basin Characterization Model (BCM) downscaled future climate scenarios developed by the Terrestrial Biodiversity Climate Change Collaborative (TBC3) for the San Francisco Bay Area (Weiss et al. in prep). The climate futures included seasonal and annual climate and hydrology variables downscaled to 270-m grid cell resolution, derived from 18 of the approximately 100 global circulation model (GCM) projections run under alternative future greenhouse gas emissions scenarios for both the 4th and 5th Assessment Reports of the Intergovernmental Panel on Climate Change (IPCC; Meehl et al. 2007; Taylor et al. 2011). These 18 scenarios were selected via a statistical cluster analysis approach to find the minimum number of futures capable of capturing the full range of 100 peer-reviewed by the IPCC (Weiss et al. in prep).
Users representing all North Bay User Groups were provided a detailed introduction to the data using data visualizations (including a “climate space plot” showing each model’s deviation from a common historic temperature and rainfall baseline) and explanatory tools. The users were then asked to help define a set of criteria (listed below) for selection of a final subset of climate futures.
- Is it a representative range of projected change that covers the full range of IPCC global scenarios and TBC3 Bay Area scenarios? The managers expressed a desire to focus on capturing the full range of temperature and rainfall scenarios for “business as usual” scenarios, and in particular wanted to capture the highest (Scenario 5) and lowest (Scenario 4) rainfall scenarios, in addition to the scenario that landed closest to the center (ensemble mean) of the full set of climate projections in terms of both rainfall and temperature change (Scenario 3). These three scenarios were intended to help bound the range of extreme conditions and capture “worst case scenarios.” Capturing “mitigated” (significantly reduced emissions) scenarios was a lower priority than having a range of “business as usual” cases.
- Is the total number of scenarios reasonable to analyze? Since comparing and contrasting model outputs is labor intensive, a range of three to six scenarios was decided upon as reasonable for detailed comparative analyses. In combination with the other criteria, managers came to a consensus to analyze six scenarios total, with more emphasis placed on three that defined rainfall extremes plus a “central tendency” for the original set of 18 futures.
- Are scenarios realistic, do they have an equal likelihood of occurring? This discussion focused primarily on the reality of emissions scenarios, with the “super-mitigated” scenarios being judged less likely based on empirical emissions data. Managers agreed that they wanted multiple “business as usual” scenarios to compare, but also wanted to include at least one “mitigated” scenario to demonstrate the benefits of climate mitigation.
- Is it consistent with the State modeling efforts? The California Climate Change Technical Advisory Group was on a parallel track to select a set of IPCC models for statewide precipitation patterns for California’s 4th Climate Assessment. To the extent feasible given that these projects were advancing in tandem, an effort to maximize the overlap between future state data products and Climate Ready North Bay products was made.
Through this facilitated dialogue, the user groups selected, by consensus, a subset of six future scenarios from which customized reports for the vulnerability assessments in Sonoma, Napa, Mendocino, and Marin counties would be developed (see below for a summarized list and Appendix A: TBC3 Selected Climate Futures for Detailed Analysis for background on scenarios).
Scenario 1: Low warming, low rainfall (mitigated emissions scenario) (GFDL-B1)
Scenario 2: Low warming, moderate rainfall (PCM A2)
Scenario 3: Warm, moderate rainfall (CCSM-4)
Scenario 4: Warm, low rainfall (GFDL-A2)
Scenario 5: Warm, high rainfall (CRNM-CM5)
Scenario 6: Hot, low rainfall (MIROC-ESM)
Basin Characterization Model
The climate vulnerability analyses were grounded in a watershed-based approach to assessing “landscape vulnerability,” with a focus on climate-driven impacts to the hydrologic cycle. The vulnerability data products are based on the six future climate projections derived from a global set of projections peer-reviewed by the IPCC (Meehl et al. 2007; Taylor et al. 2011) described above. These global models were “downscaled” to increase their spatial resolution via a California statewide downscaling effort (Flint and Flint 2012). The USGS partners on this project analyzed the downscaled historical and projected temperature and precipitation data using the USGS California Basin Characterization Model (BCM) (Flint et al. 2013; Flint and Flint 2014). The BCM models the interactions of climate (rainfall and temperature) with empirically-measured landscape attributes including topography, soils, and underlying geology. It is a deterministic grid-based model that calculates the physical water balance for each 18-acre cell (270m resolution) in a given watershed in set time steps for the entire area. See this Introduction to the Basin Characterization Model.
This approach enables a process-based translation of how climate interacts with physical geography to estimate local watershed response in terms of microclimate, runoff, recharge, soil moisture, and evapo-transpiration. The BCM is capable of producing fine scale maps of climate trends as well as tabular time series data for a place of interest. For a detailed description of the BCM inputs, methods, and resulting datasets please see: California Basin Characterization Model: A Dataset of Historical and Future Hydrologic Response to Climate Change: U.S. Geological Survey Data Release
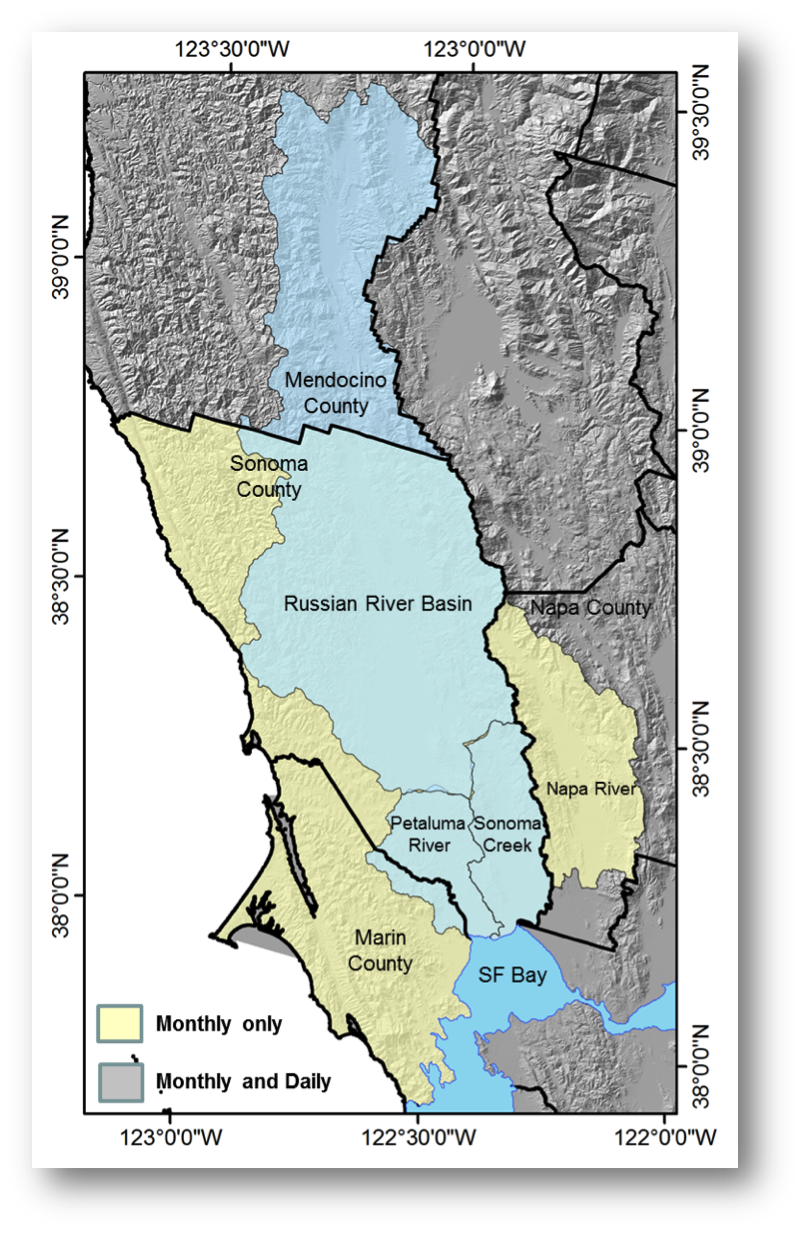
The Climate Ready North Bay project developed a customized BCM database for the North Bay region (Figure 1) extracted from the monthly California BCM and daily Russian River BCM (http://ca.water.usgs.gov/projects/reg_hydro/projects/russian_river.html). The California BCM uses a minimum time step of monthly results at the scale of a 270m grid, allowing the generation of scenarios at annual, seasonal, or monthly time steps. For Climate Ready North Bay, data was also extracted from a daily model for the Russian River to provide higher temporal resolution for evaluating potential extreme conditions within that geographic domain.
The monthly historical climate input data is downscaled from PRISM (Daly et al. 2008), and the daily data set includes historical data measured at weather stations from 1920–2010. The daily BCM model is extrapolated throughout the Russian River Basin using a method that is modified from that described in Flint and Flint (2012) in order to incorporate daily station data (Flint et al. in prep). Managers selected six future climate scenarios (described below) that provided a set of projections for the next 90 years (2010-2099). Data products derived include 30-year averages to delineate potential long-term trends in adherence with USGS recommendations. This allows comparison of three historic periods (1921-1950, 1951-1980-often referenced as a pre-climate change baseline, and 1981-2010-a period of assumed observed change) with three projected periods (2010-2039, 2040-2069, and 2070-2099).
It is important to emphasize when describing BCM data products at a finer temporal resolution than the 30-y averages (such as decades, years, months or days), that unlike a weather forecast, the model does not generate predictions of precisely when climatic events will occur, but rather generates a physically-based time series of conditions for each scenario that is considered physically possible given the state of the science. By comparing results from a range of models, statistics can be used to describe a potential range of outcomes, but presently it cannot be determined which outcome is more likely to occur.
Navigating the necessarily probabilistic nature of climate data projections is perhaps one of the greatest challenges in applying these kinds of data products to real-world management issues. While managers wish we could simply provide the most likely outcome, for inland climate conditions, due to the uncertainty in how climate change will impact rainfall in our region, we need to facilitate consideration of multiple scenarios. Presently, in general all of the scenarios need to be considered as equally likely. In the literature this has been labeled a “scenario neutral” approach (Brown et al. 2012). This is why, moving forward, real-time climate-hydrology-ecosystem monitoring, akin to the Sentinel Site at Pepperwood’s reserve, will be critical to understanding how climate impacts will unfold in the North Bay landscape (Micheli and DiPietro 2013, Ackerly et al. 2013).
In terms of spatial scale, the 18-acre resolution of BCM model pixels allows for aggregation of model results at spatial scales ranging from the North Bay region as a whole (the scale of this technical memorandum), to County boundaries and sub-regions (including watersheds, landscape units, service areas, and large parcels like parks). The vulnerability assessment team recommends that the model not be used to facilitate pixel-by-pixel comparisons, but rather be applied to minimum units ideally at the scale of sub-watershed planning units, or no smaller than parcels on the order of hundreds of acres.
The BCM’s direct outputs include potential changes in air temperature, precipitation (snow and rainfall, but for the North Bay only rainfall is significant for precipitation), runoff, recharge, potential and actual evapotranspiration, and soil moisture storage. From these direct outputs, with additional analysis, derivative products can be generated that include climatic water deficit (the difference between potential and actual evapotranspiration-an indicator of drought stress and environmental demand), water supply, and stream flow.
Climatic water deficit projections, including where deficits are projected to exceed the historical range of variability, estimate the combined effects of rainfall, temperature, energy loading and topography, and soil properties on water availability in the landscape. This is a useful indicator of landscape stress due to potential drought. The combination of runoff and recharge values together provide an indicator of variability in water supply (surface water and groundwater combined). Stream flow estimates require an additional step of accumulating flow and calibrating it to historical gage records. Projected stream flow time-series can be used to consider impacts on water supply, flooding risks, and aquatic and riparian resources.
As a result of the TBC3 initiative, climatic water deficit has been determined to be an excellent indicator of forest health, species composition, and fire risk. The secondary models described below for estimating trends in native vegetation composition and fire risks use this BCM output as a critical input in combination with soils, land cover, and other landscape metrics.
Climate Ready North Bay Vegetation Model
Risk of potential future vegetation transitions were modeled using projected proportional area of landscape cover for 22 vegetation types for the historical (1951–1980) and recent (1981–2010) periods and each of the six future climate scenarios. Projected vegetation response includes the frequency and spatial extent of suitable climate space for each vegetation type throughout the region, the potential impact of climate change on vegetation for a “landscape unit” (as defined by the Bay Area Open Space Council’s Conservation Lands Network) of interest, and an evaluation of which factors contribute to spatial variation in the sensitivity of the projected vegetation changes in response to climate (Ackerly et al. 2015).
Fire Risk Model
Statistical models of recent historical burning across the State, at a spatial resolution of 1080-m landscapes and a temporal resolution of 30 years (1971–2000) was combined with the BCM outputs (temperature, precipitation, potential evapo-transpiration, actual evapo-transpiration, and climatic water deficit) to determine how fire activity might change over time. North Bay Climate Ready futures used for this analysis include Scenarios 1, 2, and 4. Fire risk was modeled as the probability of burning occurring at least once within a given 30-year interval (2040-2069 and 2070-2099) or conversely, an estimated burn return interval. A metric of distance to human development is included in the model in order to estimate the additional influence of human access on fire risks (Krawchuk and Moritz 2012).
Brown, C, Y. Ghile, M. Laverty, and K. Li. 2012. Decision scaling: Linking bottom-up vulnerability analysis with climate projections in the water sectors, Water Resources Research, 48, W09537.
Deas, M. 2015. Cal-Adapt and the Usability of Climate Adaptation Tools. Masters Thesis, Massachusetts Institute Of Technology.
Flint, A.L., M.A. Stern, and L.E. Flint. in prep. Improved mapping of daily precipitation and air temperature using spatial downscaling.
Weiss, S.B, L.E. Flint, A.L. Flint, and E. Micheli. in prep. Choosing your futures: high resolution climate-hydrology scenarios for San Francisco Bay Area, California.