Log In or Create Account
The development of sophisticated species distribution modeling techniques provides an opportunity to examine the potential effects of climate change on bird communities. Using these modeling approaches, we are relating bird data to environmental layers to generate robust predictions of current (1971–2000) and projected future species occurrence. Future bird distributions are based on regional climate model projections for the periods 2038–2070 (IPCC Scenario A2).
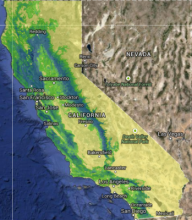
Bird species distributions were created using the Maxent modeling technique: Maxent (Phillips et al. 2006), which is able to model non-linear responses to environmental variables. Map values represent the predicted habitat suitability; the higher the values, the higher the suitability (Phillips and Dudik 2008).
Because bird distributions are greatly affected by the availability of suitable habitat, we used general vegetation type as an input to our bird models. We used the Random Forest (Breiman 2001) modeling technique to develop models and generate future projections of vegetation.
We modeled 199 different species and subspecies of birds using two different climate models (GFDL CM2.1 and NCAR CCSM3.0). These species can be selected from seven different habitat types.
For more information see: http://data.prbo.org/cadc/tools/ccweb2/cc_about_mapsdata.php